
How to… create tiles
One of the most under appreciated aspects of Tableau Prep is the ability to analyse data whilst you reshape or clean your data. In Prep Builder 2021.4 the ability to split a data set into equally divided sections called tiles became possible through a couple of clicks. Like many useful functions when preparing data, the Prep developers have simplified the process of creating Tiles so anyone can easily do this.
What is a Tile?
A tile is a division of the data set based on the number of records in the data set. For example, if you want to divide 100 records of data into 5 tiles, each tile will contain 20 records.
The allocation of the records in each tile is often based on a measure within the data set. As covered before, a data sets granularity is based on the categorical data. Therefore, we are allocating categorical values like customers, students or employees to tiles based on a measure about them. When selecting the measure, the data is sorted by the chosen value in either an ascending or descending order.
A categorical field can be used in Prep to align the records into tiles but this is then done by alphabetical order. I’m yet to find a useful reason to take the latter approach so this How To post will focus on creating tiles based on numerical fields.
Why would I want to tile my data set?
Data sets are increasingly becoming larger so dividing up the data set into smaller chunks can help make analysis easier and faster to process computationally.
Looking at the average spend for our fake airline Prep Air’s customers would just provide one number. Taking all of the airlines customers’ spending and allocating those customers into 10 tiles would provide 10 average spending values. Why is this beneficial? Well looking at the variance in average spending values would allow us to understand if we are reliant on the top spending tile if their average sales value is so much greater than all other tiles. Alternatively, if the average spending variance is similar between all the customer tiles there is less reliance on a single subset of our customers.
Creating tiles can allow you to filter the data to a smaller subset to focus your analysis. You may wish to look at the top students by their grades or alternatively only look at those students that are struggling.
How do I tile my data in Tableau Prep?
The data set used for this example comes from the week 3 2022 Preppin’ Data challenge. Click here to go to the challenge page.
Creating tiles in Prep Builder, starts within the clean step under the ellipsis menu:

When you select Tile, you are presented with Prep’s visual calculation editor that is similar to FIXED LOD and Rank options. There is another How To post that is focused on these functions here.
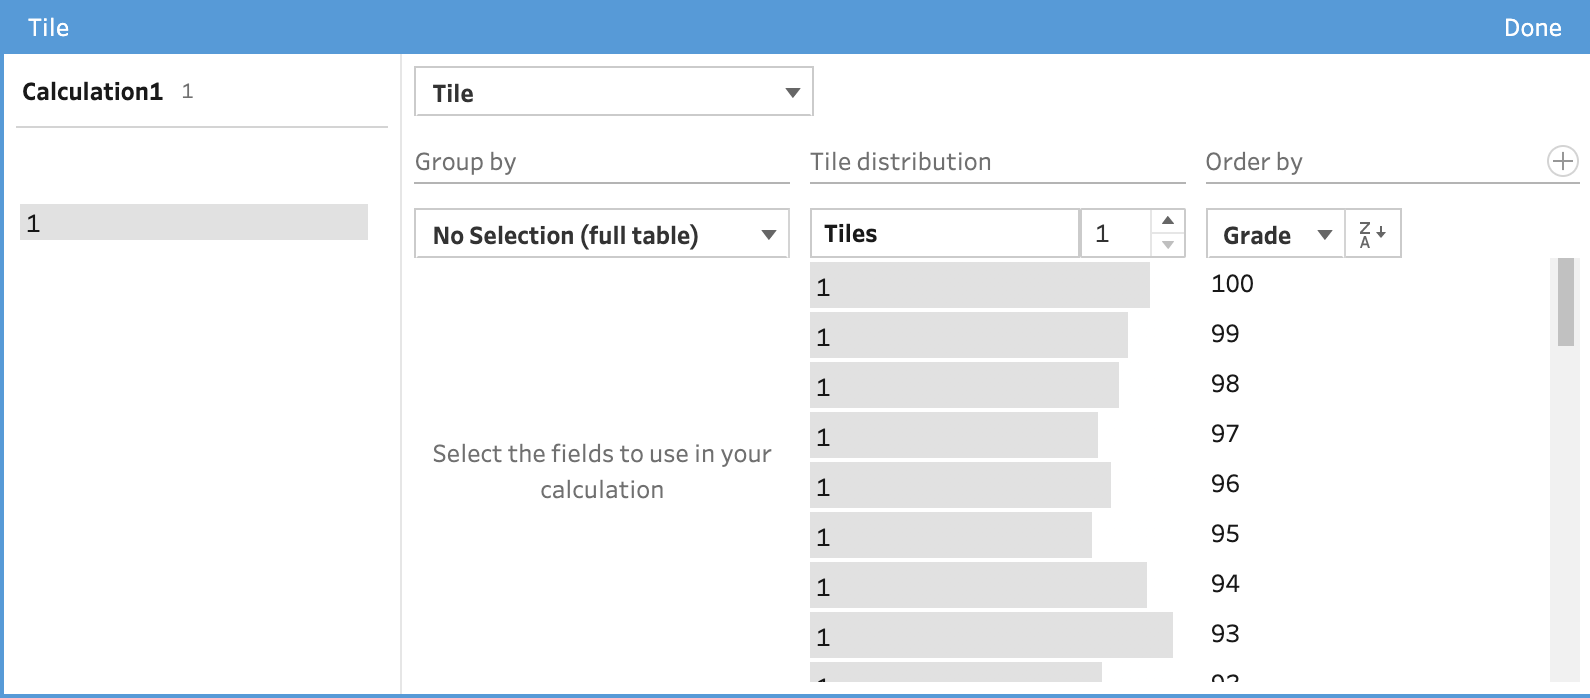
In the top left corner, you can rename the new data field that will be created from ‘Calculation1’ to something more representative of the output of the field. The values that will be contained by the field are shown underneath the name of the field. The default is that the field will create 1 tile and therefore the output is 1.
Let’s move to the right hand side of the calculation editor as before we set up the tiles, we need to understand what each tile will be based on. The example above shows this Tile field will be based on Grade as that was the field where the ellipsis menu was used to select the Tile functionality. By clicking on the dropdown arrow next to Grade in the ‘Order By’ section will allow you to pick any field in your data set. The ZA icon demonstrates how that field will be ordered. ZA demonstrates the field will be sorted in a descending order (highest to lowest). By clicking on the icon will change the icon to AZ and ensure the data is sorted in an ascending order (lowest to highest).
The ‘Tile Distribution’ section allows you to pick how many tiles you will create. This will evenly distribute all the records into the number of tiles you have selected. For example, if we select 10 tiles, we can then scroll through the unique grade values and see which tile they fall into.
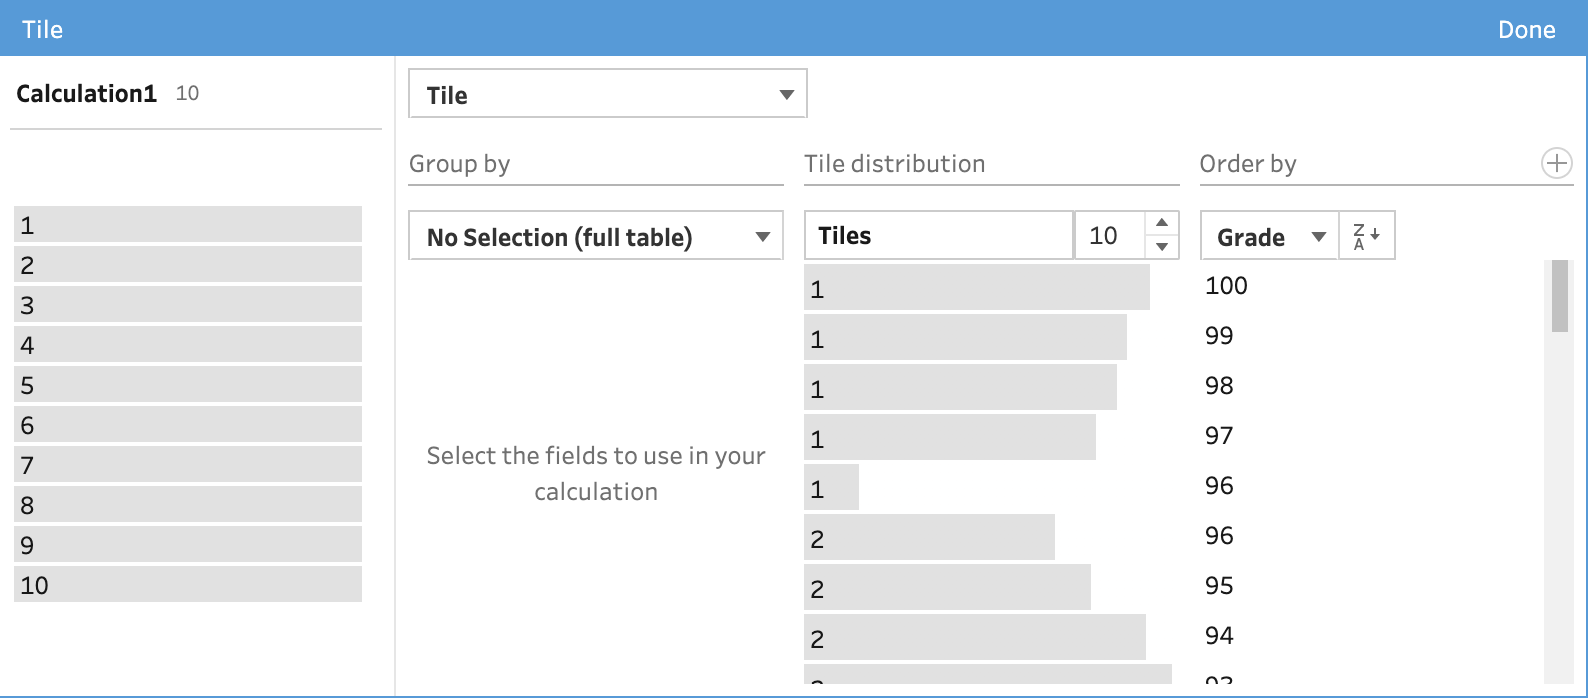
In the example above, you can see that grades of 97 to 100 all fall into the first tile but 96 falls into both the first and second tile. The length of the grey bar to the left of each value shown in the Order By section shows how many records are captured in that tile for that value.
One final option is to split the tiles into different chunks by selecting one or more fields from your data set to group the tiles by.
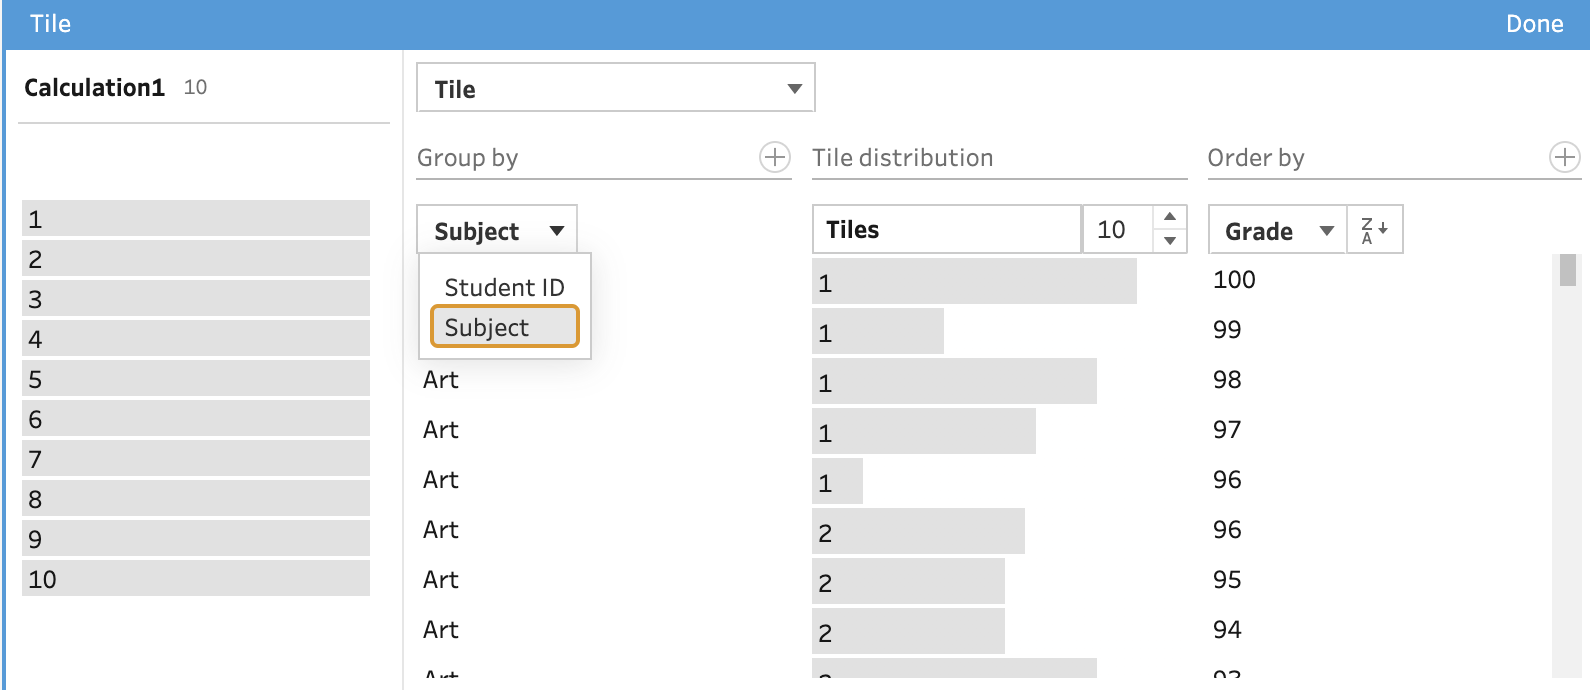
When selecting Subject to group the tiles by, the records associated to each subject will be split into 10 even tiles (as that is what we set the number of tiles to earlier). This allows us to determine what grade is needed by the students to be in the first tile (i.e. the top decile). For example, you would need to score 97 to be in the top decile in English but 96 to be in the top decile in Art.

Like all of the analytical calculation in Prep, as you use the visual editor, Prep will form the calculation and show it to you in the Changes Pane to the left side of the visual editor. This means you don’t need to use the visual editor at all and can write the calculation from scratch if you wish using the NTILE function in an analytical calculation.
The value inside the parentheses of the NTILE function determines the number of tiles you are creating with the calculation. The ORDERBY command is what allocates each record to each specific tile. You can change whether the first tile is the largest or smallest by selecting DESC or ASC respectively. The PARTITION command is optional but affects the tile values in the same way as the Group By section above.
Summary
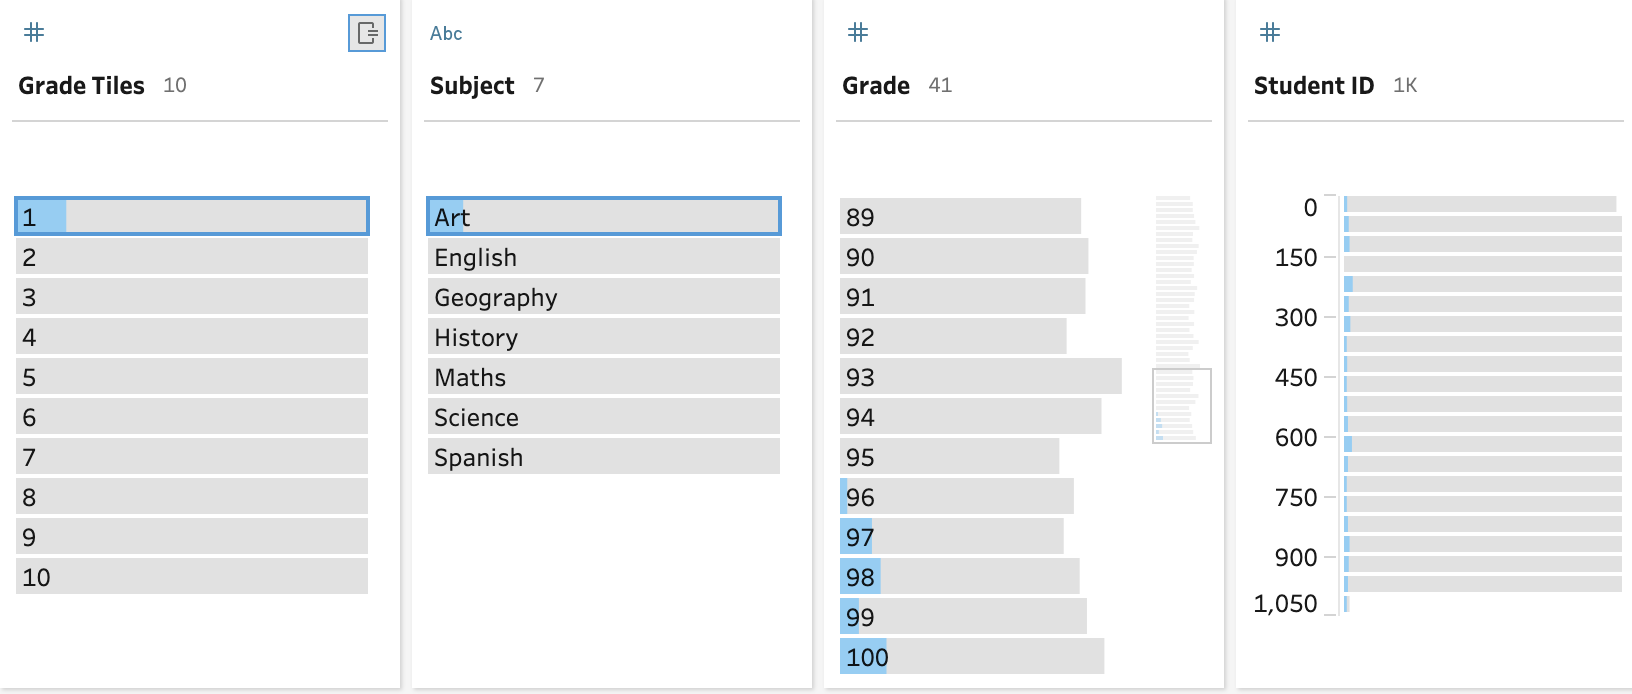
Tiles work exceptionally well when used in the Profile Pane to understand what records exist within each tile.
Creating tiles in the data preparation layer will remove complex calculations away from the users of your data set which helps reduce the skills required to complete more thorough data analysis in tools like Tableau Desktop. I’m personally looking forward to using the Tile functionality when analysing data with my clients to help articulate distributions of data that can be harder to categorise in large data sets.