
How to… output to a spreadsheet
When you have finished preparing your data for analysis there are three main types of output for Prep Builder:
File
Database Table
Published Data Source
Until version 2021.1.2 the file output were limited to:
Comma Separated Values
Tableau Data Extract
However as of the new version (2021.1.2 released March 2021), you now have the chance to output to a spreadsheet file type too.

Option to output your data as a spreadsheet
Unlike the other file types, there is an additional choice to make when you are choosing to output to spreadsheets. You need to choose what worksheet to write too within the Excel workbook. If you are creating a brand new file to write to, you will need to create the worksheet to write that output to:

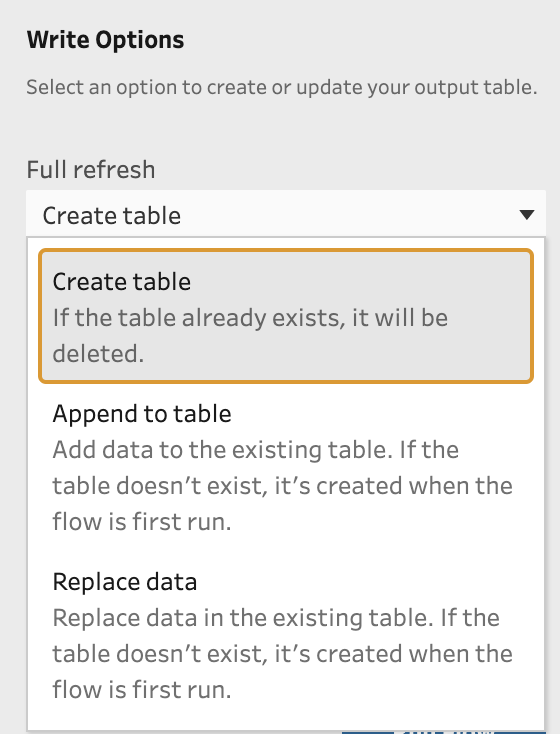
Once you have decided your new worksheet name, you will need to select how you want the output to run. Prep Builder defaults the Write Option (for me at least) to Append to Table and therefore to get the flow to run I need to select Create Table or Replace Data as each of these options creates the worksheet if it doesn’t already exist. In my example, I am creating a new spreadsheet so nothing exists until I run the flow.
With all output to file options, I recommend the following order to setting up the file you are writing to:
Select your file type you are writing too
Click Browse to select where the file is that you are editing or where you want the new file to be located
Name the file in the Browse
Just for the Excel output, name your worksheet
An Example of creating an Excel output
Let's use Tableau’s demo data set of Superstore. With many organisations, different teams have wanted different data sets personalised to themselves. Whilst I advocate managing this through Tableau Server using User Filters, sometimes a separate data set is required. Let’s use Prep Builder to complete this task.
When inputting this data set I’m only going to leave Order ID, Product ID, Segment, Sales and Profit to make it easier to what is happening in my flow:

Use the selection box next to Type to deselect all data fields as we only need five before selecting the fields listed above.
Requests for forming these types of out typically occur when teams are being reorganised. Let’s merge together Home Office with Consumer in the Segment data field.

Prep Builder adds the value of Individual to the grouping as I renamed the grouping to that name.
The final stage before outputting the data to the spreadsheet is to create a separate flow for each Segment: Corporate and Individual. This can be achieved in Prep Builder by adding a two Clean steps after the Clean Step where the grouping happens. One Clean step can filter for the Corporate Segment, the other filters for Individual Segment. If you’re following along, your flow will look like this:

The final act is to add an Output after both the Corporate Clean step as well as Individual. This is because I want to create two worksheets of data but add them to the same Excel workbook. Setting up these outputs is a little tricky when you are creating the file from scratch as you need to remember exactly what you are calling the new file and where you are writing it to. Once you have the file name set up in one Output, it isn’t listed in the Browse of your files as you are yet to create it (unless you have already run the flow).
Once you have set up the outputs, you can run the flow for both steps at the same time and you will create your new Excel workbook with two separate worksheets inside.

The final output in Excel with the two spreadsheets of data
The final flow will should look like this:

The complete Prep workflow to create the workbook and worksheets
Summary
With output to spreadsheet, many users will take advantage of pushing data straight to Excel. I hope this won’t be a default action for you as I believe Desktop or Server are the right places to be analysing you data. Analysing data in Excel can be cumbersome and it’s easy to make mistakes. However, if you are using the output to a spreadsheet option to update a messy file so every other user doesn’t have to do the same work time and again then go for it!